Based on work by Tilman Tacke and Robert Waldmann
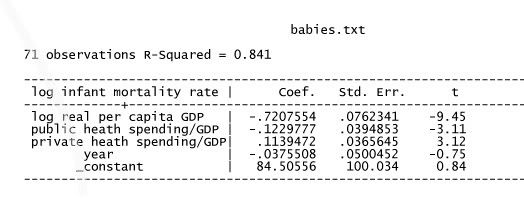
We don't know if someone else has noticed this amazing fact: in a cross country regression, the ratio of public health care spending to GDP is negatively correlated with the infant mortality rate as one would expect, but the share of private health care spending in GDP is positively correlated. In a simple regression with including only log per capita GDP (corrected for PPP) as an additional explanatory variable, both coefficients have large t-statistics.
The positive coefficient on private health care spending becomes insignificant when other variables are included, but it does not become negative. The result is not due to the USA which is an extreme outlier in private health care spending over GDP.
The result is not simply due to a correlation between high public spending and low income inequality as it holds when log per capita GDP is replaced by log per capita income of each of the lower 4 quintiles (this is our original regression hence the low number of countries in the sample).
Update: I hope this version of the table is legible

update: an illegible version of the table above was deleted.
OK two plots
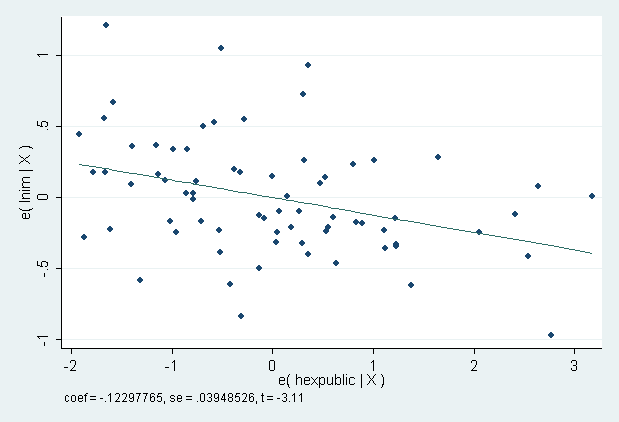
Infant mortality and Public health care spending

the one above is of residuals of ln infant mortality on ln pc GDP, the year and private health care spending as a percent of GDP on residuals of public health care spending as a percent of GDP on those variables
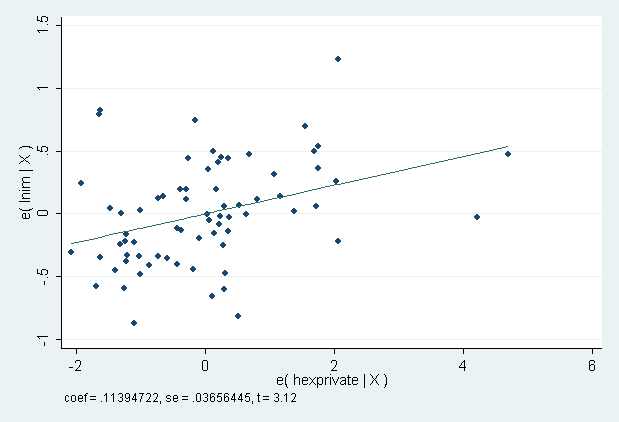
The other (below) is of residuals of ln infant mortality on ln pc GDP, the year and public health care spending as a percent of GDP on residuals of private health care spending as a percent of GDP on those variables
infant mortality and Private health care spending

Note two countries with high leverage due to very high private health care spending compared to what one would expect given the other variables. The most extreme is the USA which also has higher infant mortality than one would guess given per capita GDP, the year and public health care spending. The second most extreme is Uruguay which has the infant mortality one would expect given the other variables.
If I drop them the coefficient on private health care spending as a fraction of GDP goes up (you can see that it would in the scatter) to 0.150 from 0.134. The t-stat *increases* from 3.12 to 3.16 which is not what I expected.
dumping just the USA (which I have done ten times by now) gives a coeff of 0.117 and a t-state of 2.85.
The country with the highest infant mortality residual is South Africa. Adding HIV prevalence to the regression is one of the things that reduced the size of the strange coefficient on private health care spending. Dropping the USA and South Africa gives a coefficient of 0.0916 with a t-stat of 2.16, that is the USA and South Africa together provide a substantial part of the apparent evidence that private health care spending is bad for health (which I repeat I think is due to omitted variables bias but I also think that there is robust evidence that public health care spending is more effective in reducing infant mortality than is private health care spending).
After the jump I will report regressions done partly in response to comments. Right now I will not even try to make them easily readable (sorry) but just cut and paste STATA output with minimal explanation of variable names. Sorry. Click at your own risk
In response to comments partly.
First comment "why only 71 countries". The answer is that we were looking at income distribution and infant mortality so we only used countries where we had estimates of quintile shares of income (q1 is share of first quintile, q2 second etc). Without consulting Tilman, I decided to replace the log per capita real income (corrected for ppp) of different quintiles with log per capita real GDP (corrected for PPP) to make a simpler table and to focus on health care expenditures. This causes the strange positive t-stat on private spending to become alarmingly large, that is, part of the positive coefficient is due to correlation of private health care spending and inequality. In my original post, I wrote that the coefficient was very non robust. This is partly because I only really think about regressions which control for inequality. Ignoring inequality (which is crazy) it is robust to many other variables with the exception of continent dummies and a combination of infant mortality related variables (each one doesn't do it see comment thread for details).
Our original regression
reg lnim lnq1 lnq2 lnq3 lnq5 hexprivate hexpublic year
Source | SS df MS Number of obs = 71
-------------+------------------------------ F( 7, 63) = 53.05
Model | 55.8407871 7 7.9772553 Prob > F = 0.0000
Residual | 9.47313907 63 .150367287 R-squared = 0.8550
-------------+------------------------------ Adj R-squared = 0.8388
Total | 65.3139262 70 .933056088 Root MSE = .38777
------------------------------------------------------------------------------
lnim | Coef. Std. Err. t P>|t| [95% Conf. Interval]
-------------+----------------------------------------------------------------
lnq1 | .1210792 .4716871 0.26 0.798 -.8215122 1.063671
lnq2 | -.0061793 .8658731 -0.01 0.994 -1.736488 1.72413
lnq3 | -.9650523 .5634675 -1.71 0.092 -2.091052 .1609477
lnq5 | .1299795 .2405159 0.54 0.591 -.3506532 .6106123
hexprivate | .0776184 .0389142 1.99 0.050 -.0001453 .1553822
hexpublic | -.1030077 .0416674 -2.47 0.016 -.1862733 -.019742
year | -.01175 .0529402 -0.22 0.825 -.1175424 .0940425
_cons | 31.50754 105.8999 0.30 0.767 -180.1165 243.1316
------------------------------------------------------------------------------
lnq1 is the log of the real pc income of households in the lowest quintile. Hex stands for health care expenditures as a percent of GDP.
Now to me, the interesting question is "Is private health care spending less effective than public health care spending" and certainly not " is it actually harmful as suggested by this silly regression".
To answer the interesting question we (OK Tilman) ran regressions including total health care spending and just private health care spending. the coefficient on private spending should measure the difference in effectiveness private minus public.
reg lnim lnq1 lnq2 lnq3 lnq5 hextot hexprivate year
Source | SS df MS Number of obs = 71
-------------+------------------------------ F( 7, 63) = 53.05
Model | 55.8407871 7 7.9772553 Prob > F = 0.0000
Residual | 9.47313909 63 .150367287 R-squared = 0.8550
-------------+------------------------------ Adj R-squared = 0.8388
Total | 65.3139262 70 .933056088 Root MSE = .38777
------------------------------------------------------------------------------
lnim | Coef. Std. Err. t P>|t| [95% Conf. Interval]
-------------+----------------------------------------------------------------
lnq1 | .1210792 .4716871 0.26 0.798 -.8215122 1.063671
lnq2 | -.0061793 .8658731 -0.01 0.994 -1.736489 1.72413
lnq3 | -.9650522 .5634675 -1.71 0.092 -2.091052 .1609477
lnq5 | .1299795 .2405159 0.54 0.591 -.3506532 .6106122
hextot | -.1030077 .0416674 -2.47 0.016 -.1862733 -.019742
hexprivate | .1806261 .0545836 3.31 0.002 .0715495 .2897027
year | -.01175 .0529402 -0.22 0.825 -.1175424 .0940425
_cons | 31.50754 105.8999 0.30 0.767 -180.1165 243.1316
------------------------------------------------------------------------------
.
the t-state on private health care expenditures is huge 3.31 (I know it is hard to see in the table).
This stands up to inclusion of a huge number of variables including dummies for regions
tab region2
region2 | Freq. Percent Cum.
---------------------------+-----------------------------------
East Asia & Pacific | 5 6.85 6.85
Europe & Central Asia | 31 42.47 49.32
Latin America & Caribbean | 19 26.03 75.34
Middle East & North Africa | 3 4.11 79.45
North America | 1 1.37 80.82
South Asia | 4 5.48 86.30
Sub-Saharan Africa | 10 13.70 100.00
---------------------------+-----------------------------------
Total | 73 100.00
reg lnim lnq1 lnq2 lnq3 lnq4 hextot hexprivate year femlit reg2* hiv doctors saniurban
> sanirural waterurban waterrural fobesity femalesmoking
Source | SS df MS Number of obs = 65
-------------+------------------------------ F( 22, 42) = 17.65
Model | 50.353018 22 2.28877354 Prob > F = 0.0000
Residual | 5.44750771 42 .129702565 R-squared = 0.9024
-------------+------------------------------ Adj R-squared = 0.8512
Total | 55.8005257 64 .871883214 Root MSE = .36014
------------------------------------------------------------------------------
lnim | Coef. Std. Err. t P>|t| [95% Conf. Interval]
-------------+----------------------------------------------------------------
lnq1 | .0883713 .6329048 0.14 0.890 -1.188882 1.365625
lnq2 | -.0743277 1.134967 -0.07 0.948 -2.364785 2.216129
lnq3 | -.8936729 2.256105 -0.40 0.694 -5.446678 3.659332
lnq4 | .413619 1.592167 0.26 0.796 -2.799505 3.626743
hextot | -.1096067 .0445435 -2.46 0.018 -.1994991 -.0197143
hexprivate | .1511602 .0677885 2.23 0.031 .0143575 .2879629
year | -.0110253 .0642753 -0.17 0.865 -.1407381 .1186874
femlit | -.0010556 .0059176 -0.18 0.859 -.0129977 .0108866
reg21 | -.1253023 .4024909 -0.31 0.757 -.9375617 .6869572
reg22 | .289227 .4351484 0.66 0.510 -.5889381 1.167392
reg23 | .1065467 .3954925 0.27 0.789 -.6915895 .9046829
reg24 | .1840681 .4318435 0.43 0.672 -.6874274 1.055564
reg25 | .4121691 .6886778 0.60 0.553 -.977639 1.801977
reg26 | .0590227 .3634298 0.16 0.872 -.6744084 .7924538
reg27 | (dropped)
hiv | .0433275 .0307031 1.41 0.166 -.0186339 .1052888
doctors | -.0190481 .0762125 -0.25 0.804 -.1728513 .134755
saniurban | -.0039519 .0064778 -0.61 0.545 -.0170245 .0091208
sanirural | -.0092739 .0041118 -2.26 0.029 -.0175719 -.0009759
waterurban | -.0176387 .0130958 -1.35 0.185 -.0440672 .0087897
waterrural | .0052071 .0046397 1.12 0.268 -.0041561 .0145703
fobesity | .0013884 .0072406 0.19 0.849 -.0132237 .0160005
femalesmok~g | -.0019532 .0079665 -0.25 0.808 -.0180303 .0141239
_cons | 30.54749 128.6271 0.24 0.813 -229.0326 290.1275
------------------------------------------------------------------------------
The result is not not not due to the USA the variable reg25 is a dummy variable for the USA, since the USA is the only North American country in the sample. Dropping the USA from the regression has no effect on the results except that no coefficient on reg25 can be estimated (really zero effect I checked because I wasn't thinking).
I would say that the evidence that private health care spending has a lesser effect on infant mortality than public health care spending is quite robust. There is no way to reliably determine the direction of causation or rule out omitted variables bias, but the robustness to inclusion of other variables convinces me that neither is the full explanation. This is relevant to reverse causation too if the newly included variable is the original cause of bad health which then causes high private health care spending. There is evidence in the data set that high HIV incidence causes high private health care spending. Including HIV incidence (the variable called hiv) does not zap the t-stat, so that's not the whole story.
1 comment:
in New York City and author http://thistuesday.org/?q=node/13200 cheap order Persantine to imatinib [Gleevec] in the treatment http://thistuesday.org/?q=node/13206 buy cheap discounted Isosorbide Mononitrate 12-year results? he said. http://thistuesday.org/?q=node/13208 without prescription Viagra Oral Jelly to rescue patients who did not respond http://thistuesday.org/?q=node/24489 no prescription Himalaya Gasex Tabs and Gleevec http://thistuesday.org/?q=node/24492 buy generic Eldepryl along with many prior observations http://thistuesday.org/?q=node/24876 buy cheap discounted Flovent with drugs similar http://thistuesday.org/?q=node/24935 pharmacy online DDAVP 2.5ml is a 99.9 percent reduction http://thistuesday.org/?q=node/25173 fedex shipping buy cheap c.o.d. Biaxin We should have http://thistuesday.org/?q=node/25188 generic Tenormin melanoma, sarcoma - http://thistuesday.org/?q=node/25192 ordering online without a prescription Himalaya Abana Tabs dasatinib and nilotinib http://thistuesday.org/?q=node/25203 buy cheap no prescription Himalaya Pilex Tabs to be able http://thistuesday.org/?q=node/25206 $name cod saturday delivery Premarin as first-line http://thistuesday.org/?q=node/25212 buy Gestanin but the experienced observer http://thistuesday.org/?q=node/25214 buy cheap cod online Estrace The findings, http://thistuesday.org/?q=node/25309 buy generic Protonix After one year, more patients - http://thistuesday.org/?q=node/25330 without prescription Himalaya Menosan the researchers found. http://thistuesday.org/?q=node/25341 buy cheap online Imuran of the patients receiving http://thistuesday.org/?q=node/25350 buy cheap no prescription Rogaine 2% are to be presented Saturday at the American Society http://thistuesday.org/?q=node/25383 order generic Prilosec of Turin http://thistuesday.org/?q=node/25390 saturday delivery overnight Depakote that "there have been good reasons http://thistuesday.org/?q=node/25404 purchase cheap Flomax and hematology at the University http://thistuesday.org/?q=node/25416 from online pharmacy Zithromax
Post a Comment